Unsupervised Monitoring and 3D Reconstruction of Single-Camera Snooker Video

The thesis*, written by Engel Hamer, introduces the idea of capturing a snooker game and reconstructing it for training purposes. The game is captured using only a single overhead camera at 25 frames per second and is powered by a Raspberry Pi. This computer will extract information from the video frames and creates a JSON export of the analysed game. This JSON file can be interpreted by a web application which creates a 3D reconstruction of the game.

On this page, we will take a closer look at the computer vision pipeline. In particular, we will zoom in on the journey of a single video frame that gets processed until all information is extracted and the program moves on to the next frame.

* the thesis can be downloaded from here.

Initial setup

Three steps have to be done to initialize the system: calibration of the camera, transformation of the perspective, and extraction of the table and background.

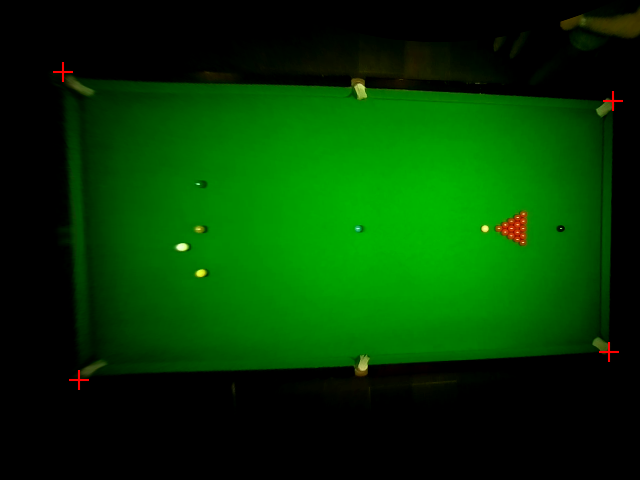
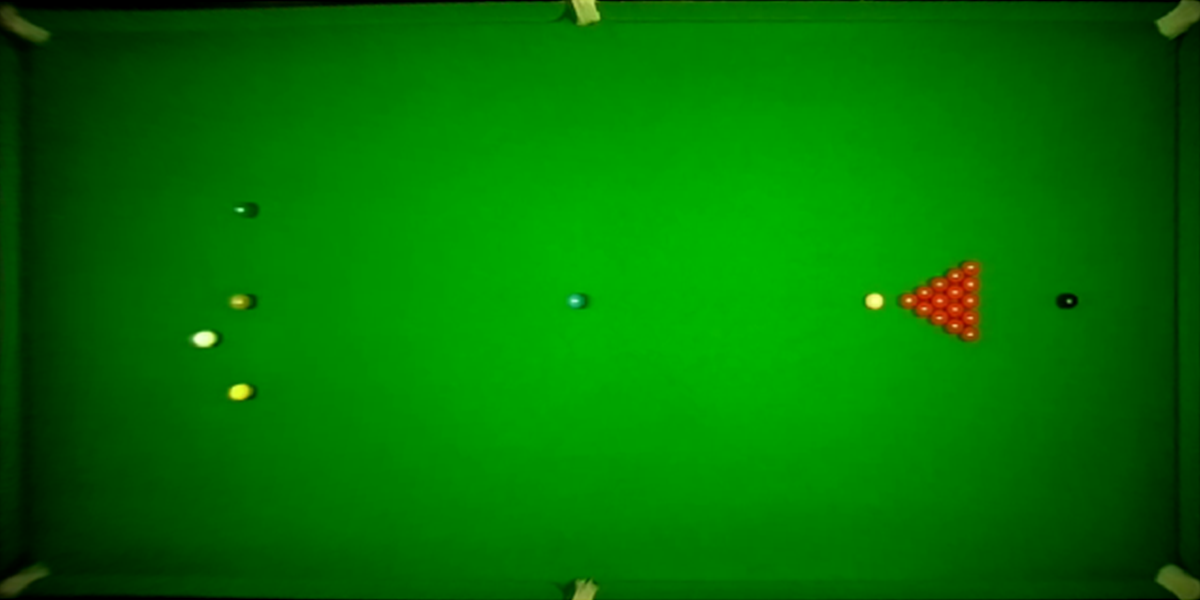
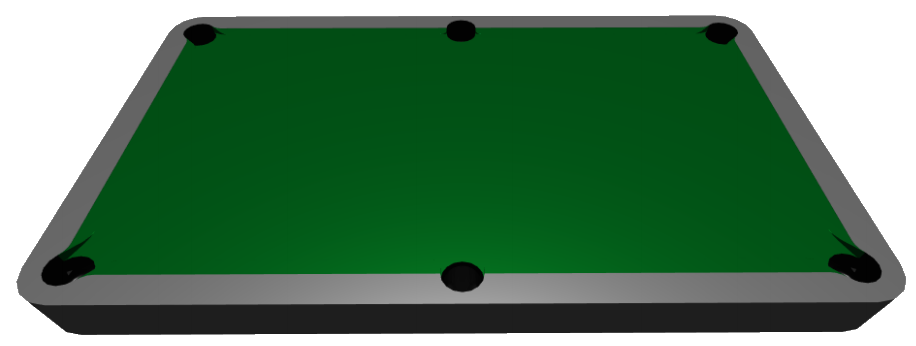
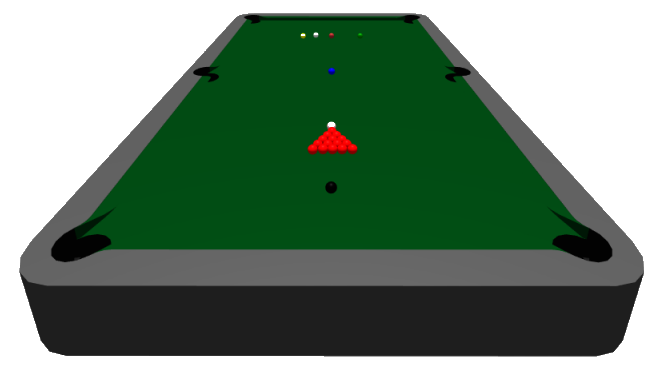
In the calibration phase, the system finds the corners of the playing field to initialize the locations of the pots, this is necessary for potting detection. Also, the location of the playing field is necessary to perform camera undistortion.

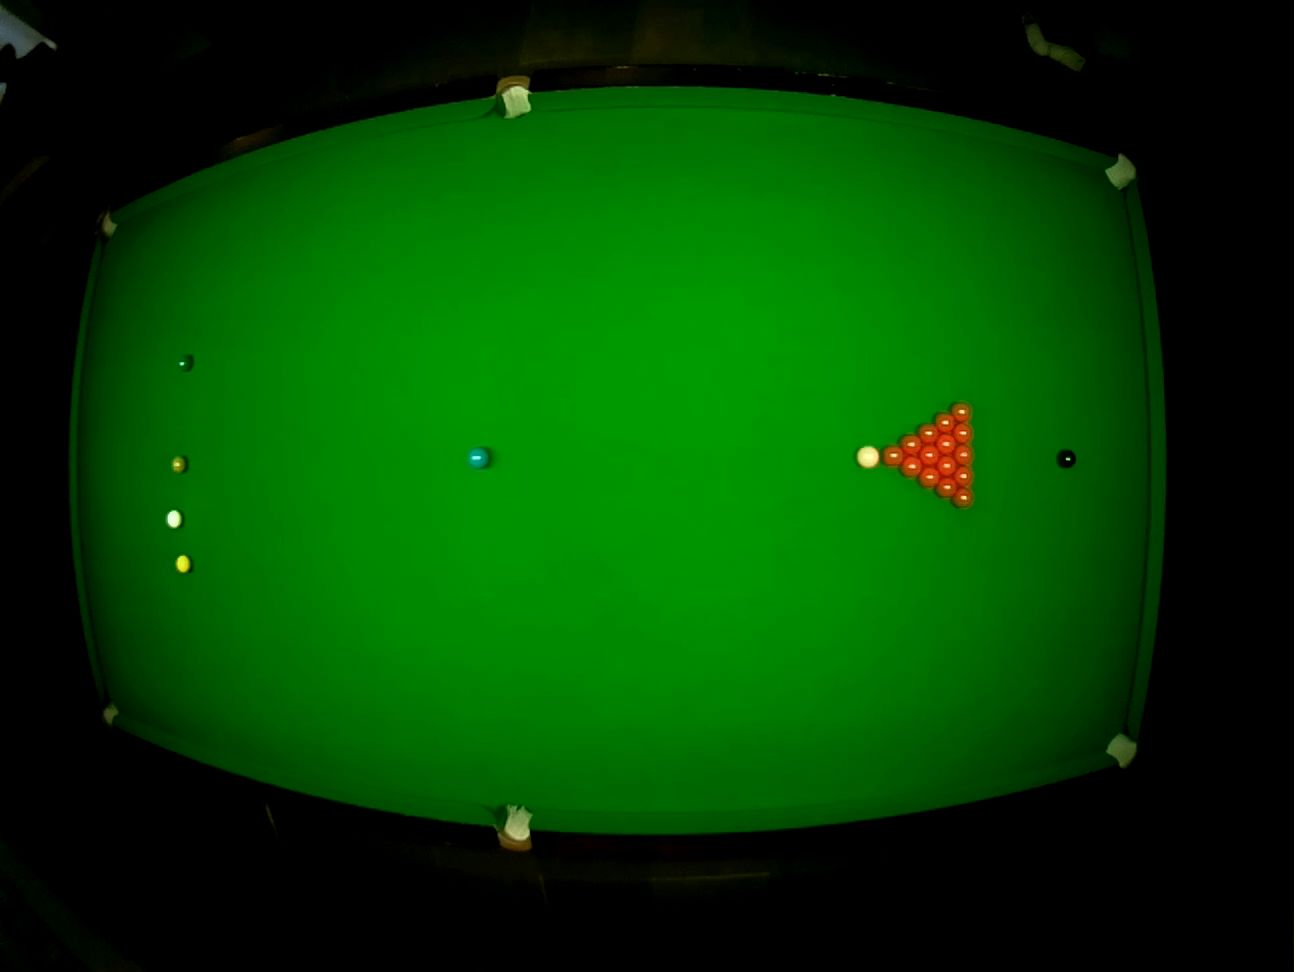
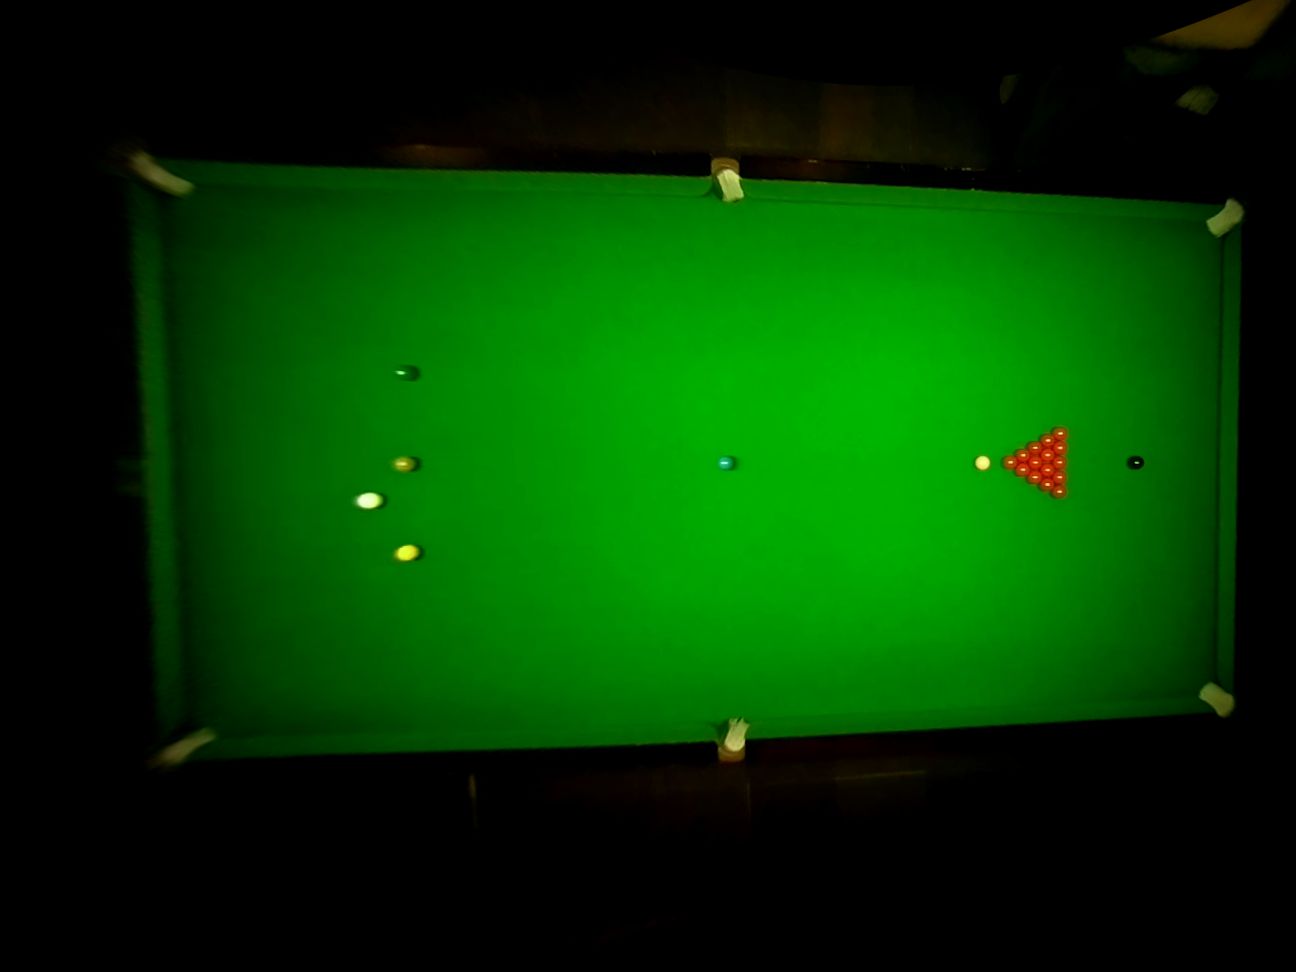
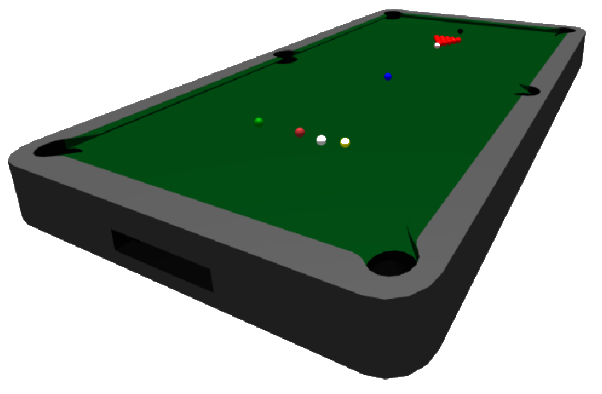
The system should allow for mounting the camera on any place above the table. This brings difficulties when extracting the table area from the image, because this makes regular cropping fall short. Therefore, transforming the camera perspective and camera undistortion is done to correct the camera view. This relaxes the requirement for mounting the system exactly above the center of the table, allowing camera perspectives at a slight angle.

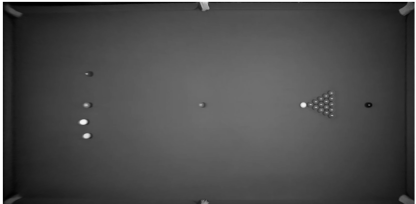
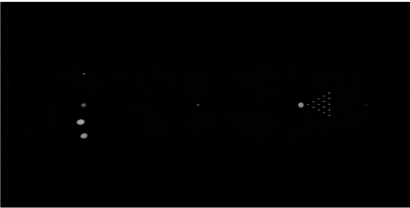
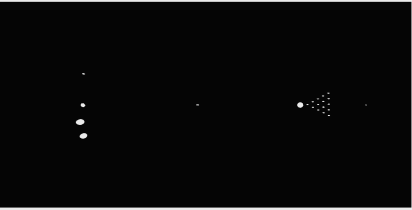
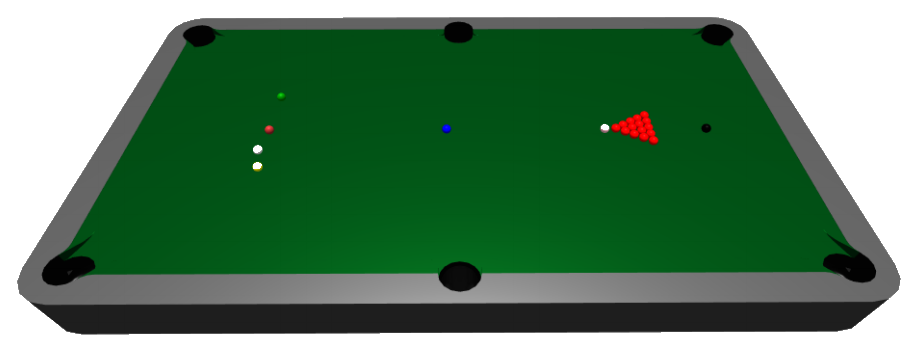
The last step in the initial setup is background extraction. This is done by blurring the area in the first frame where the balls are. This area is spanned by the green and yellow balls as the vertical boundaries, and the D-area and the black ball spot as the horizontal boundaries. The greyscale background image of the scene generated here is used later for ball detection.

Selecting background area Greyscaled background
Fig 4.6 P221

Camera undistortion

Distorted table Normal table
Fig 4.2 P181

A fisheye lens is used to capture the whole snooker table as it has a large field of view. Unfortunately, this increased field of view comes with some distortion. Straight lines will appear to be curved in the image. To remove the distortion, the distortion coefficient of the lens used is needed.

All lenses have a unique distortion coefficient. To find this number, the OpenCV library provides a checkerboard calibration procedure. Once the distortion coefficient is known, distorted points can be remapped to their original location. This effectively undistorts the image.

QUIZ - What is the distortion coefficient used for?

A) To detect straight lines in the image.
B) To map distorted image points to their original location.
C) To filter noise from the image.

Table extraction

Detected table area
Fig 4.3 P191

Next, the table must be extracted from the footage and transformed to a rectangle. Colours are first selected using a threshold based on the table's green colour. The biggest blob of these pixels are assumed to be the table and extracted.

Detected table area
Fig 4.4 P201

After that, the four corners of the table can be detected. These are calculated by taking the intersection of the four edges of the table. The edges themselves are detected using a Hough transform. This algorithm can detect straight lines in images. The four longest lines are simply taken as the table's edges.

Detected table area
Fig 4.5 P221

Because of the camera's position and rotation, it is possible that the table is not a perfect rectangle in the image. The final table image is thus created using a perspective transformation to correct this.

QUIZ - Why do we create black and white masks?

A) Black and white have a high contrast.
B) This is unnecessary but looks cool.
C) To only look at specific features of the image.

Ball detection

To detect the ball, background subtraction is used to show pixels brighter than the background. This is almost always true for snooker balls due to the reflectivity of the ball causing strong highlights on video, showing spots that are much brighter than the matte table surface. A threshold is applied to filter out noise: if the difference in intensity between the source pixel and the background is at least 30, the reduced image will have an intensity of 1 at that position. Otherwise the intensity will be 0.

Original frame Intensity differences Thresholded differences

Fig 4.9 P251

When balls are very close together the computer might not be able to see the individual balls. To detect the locations, connected component labeling is applied, and when these components cover a larger area than expected for a ball, the components are eroded, or shrunk, after which the centroids of the areas are computed resulting in the balls' positions.

Player detection

To detect players in the frame, it is required to use absolute intensity differences, because the player might be wearing clothes darker than the table, for example. From here, it can be observed that not all pixels belonging to the player area are interconnected, which is a side effect of the threshold process. To mitigate this, the thresholded image is dilated, allowing for gaps up to 10 pixels to be filled in, without letting any balls connect to the edge of the frame. This is important, because a rule states that players should always have 1 foot on the ground, implying the player will always be connected to the edge of the frame. This is leveraged to detect the player.

Dilation

Fig 4.10 P251

This introduces another problem: The player mask might be connected to the cue ball, such as when the player strokes. To fix this, the image is eroded in a 20x20 box surrounding the last known location of the white ball.

Erosion

Fig 4.11 P261

Potting detection

To detect potting two regions originating from each pocket are defined. One smaller region and a larger, encompassing region. In each region the detected balls are counted. With the difference between ball counts across two consecutive frames it is possible to determine which event took place.

Pot detection method
Fig 4.12 P261

Three possible events are illustrated in the figure above where the top row is the previous frame and the bottom current frame.

QUIZ - What fault may occur due to a fast travelling ball?

A) The travelling ball is not detected.
B) A potted ball is undetected by the system.
C) No fault can occur.

Trajectory construction

To track the balls the position and color of the balls need to be detected in the current and previous frame of the video.

After this detection the tracking is done by finding the best fit for the mapping between the old locations and the newly detected location of the balls. As this assignment problem has \(n!\) possible solutions a brute force algorithm won't be able to create a optimal solution within reasonable time. A more efficient algorithm to find an optimal solution, of which there can more than one, is the Kuhn-Munkers algorithm which has a complexity of \(O(n^3)\).

This algorithm creates a \(n*n\) matrix for \(n\) tasks and \(n\) agents. In this case the agents are the original locations of the balls and the tasks are the new locations. The values of such a matrix are the costs of assigning a task to an agent. An example of such a matrix could be: $$ \begin{bmatrix} 50 & 35 & 15 \\ 10 & 40 & 60 \\ 55 & 20 & 15 \end{bmatrix} $$ The first step in solving the problem is finding the lowest cost per row and substracting this cost from every position in that row. After this step the matrix looks like this: $$ \begin{bmatrix} 35 & 25 & 0 \\ 0 & 30 & 50 \\ 40 & 5 & 0 \end{bmatrix} $$ The next step to do the same thing for the columns. In this case the matrix doesn't change. To check if an optimal solution is found you can draw lines through every column and row containing a zero. If the amount of lines is equal to \(n\) an optimal solution is found. This solution is equal to the assignments using the zero's in the matrix such that every column and row has atleast one zero. $$ \begin{bmatrix} 35 & 25 & \color{red}{0} \\ \color{red}{0} & 30 & 50 \\ 40 & 5 & \color{red}{0} \end{bmatrix} $$

Reconstruction

For the reconstruction of the match in 3D, a web application is created using the A-Frame graphics framework, this makes the system easy to use for anyone with a web browser.

When the system is launched, a 3D model of an empty table is generated. The user can then load a prerecorded match from a JSON file, each ball is rendered as a coloured sphere on the table.

Empty 3D reconstruction Loaded 3D reconstruction
Fig 4.13 P291

The user is able to rotate the camera by dragging across the screen and to ajust the camera height and zoom by the use of touch and mouse controls. This allows for viewing the table from any desired perspective, which makes the system perfectly suitable for intuitive snooker training.

Rotation example 1 Rotation example 2
Fig 4.14 P291

Ball trajectories are animated using the graphics framework. Linear interpolation is used to increase the frame rate of the original video to an animation of 90 frames per second.

QUIZ - What does the user need to run the 3D reconstruction?

A) An installation of the A-Frame graphics framework.
B) A web browser.
C) An installation of the 3D snooker reconstruction software.

About

This page is made by Bryan Westerveld, Cas Steigstra, Marten Steketee, Nick Moone, Pim Kunis en Yasser Kaloe.